
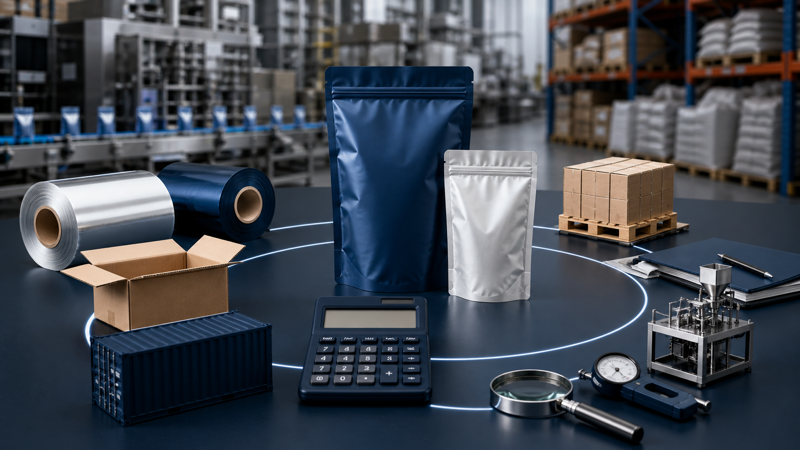
The quoted price per pouch is only one part of packaging cost. A cheaper unit can become expensive after plates, samples, freight, duties, storage, filling losses, leakage, obsolete inventory, and customer complaints are included. A more capable structure may cost more at purchase but reduce product waste, improve line speed, or allow more units per shipping case.
Total cost of ownership turns these tradeoffs into a comparable model. It follows the package from design through disposal and assigns cost to the decisions that materially change cash, labor, risk, or product value. The model does not need false precision; it needs consistent boundaries, documented assumptions, and realistic scenarios for every option under review.
Start With the Same Packaging Specification
Costs are comparable only when quotations cover the same functional requirement. Freeze pouch type, dimensions, laminate, thickness, barrier, printing, colors, finish, zipper, valve, spout, tear notch, tolerances, compliance evidence, packing method, and delivery terms. If one supplier quotes a stock film and another quotes a validated high-barrier structure, the unit prices describe different products.
Use the range of packaging products to define the format, then record all assumptions in a specification sheet. Ask suppliers to identify exclusions, tooling ownership, overrun tolerance, minimum order, lead time, and validity period. This creates a clean acquisition-cost baseline before broader operating costs are added.
Acquisition Cost
The direct purchase total begins with saleable units multiplied by quoted unit price. Add plates or cylinders, cutting dies, setup, prepress, color proofs, printed prototypes, testing, and project-management fees. Some tooling is paid once and reused; amortize it across the expected number of repeat orders rather than placing all cost on one run when evaluating a stable program.
Include expected overrun, underrun, and startup waste. If the purchase order allows 10 percent overrun, model the cash required and whether the extra inventory will be consumed. Calculate cost per accepted usable package, not merely per nominal unit produced.
Currency and payment terms affect landed cost. Record exchange-rate assumptions, deposits, letter-of-credit or transaction charges, and the cost of working capital between payment and product sale. Long lead times can tie up cash even when the ex-works pouch price is low.
Freight, Duties, and Receiving
Add inland transport, export handling, ocean or air freight, insurance, customs brokerage, duties, tariffs, port charges, destination delivery, and any tax that is not recoverable. Use the agreed Incoterm to prevent costs from being counted twice or omitted. A quote under EXW, FOB, CIF, and DDP transfers cost and risk at different points.
Flexible pouches are light, but premade pouches can occupy significant carton volume. Compare shipping density, cartons per pallet, and units per container. Emergency airfreight caused by a late order can erase months of unit-price savings, so include an expected expediting allowance if the supply plan is fragile.
Receiving also has cost: inspection labor, sample testing, quarantine space, count discrepancies, and handling. Poor packing can create curled pouches, damaged zippers, telescoped rolls, or contamination that appears only at the filling line. Supplier packaging and pallet quality therefore belong in the economic comparison.
Inventory and Obsolescence
MOQ and lead time determine how much packaging must be held. Estimate average inventory, warehouse space, handling, insurance, damage, and financing cost. Include aged stock that may block, curl, lose treatment, absorb moisture, or become unsuitable after excessive storage.
Printed packaging can become obsolete after an ingredient, claim, barcode, regulation, distributor, address, or design change. Multiply the probability of a change by the value of inventory likely to be discarded or relabeled. Shorter runs may carry a higher unit price but a lower expected obsolescence cost.
Model three demand scenarios: slow, expected, and fast. Slow sales expose write-off and storage risk; fast sales expose stockout and emergency freight risk. The best order quantity often lies between the price-break minimum and the full optimistic forecast.
Filling-Line Economics
Packaging affects throughput. Measure pouches or film used per hour, changeover duration, labor, startup scrap, stops, seal contamination, misfeeds, zipper opening, registration, static, curl, coefficient of friction, and code quality. A difference of a few packages per minute can be more valuable than a small material-price reduction.
Film roll packaging can offer high filling speed and shipping efficiency, but it requires compatible form-fill-seal equipment and controlled roll specifications. Premade pouches reduce the equipment needed to form the pack but may feed more slowly or require additional opening and handling. The comparison of roll stock film vs premade pouches helps frame this production choice.
Calculate conversion cost per good filled pack:
Conversion cost per good pack = (labor + machine time + utilities + changeover + expected scrap) ÷ saleable filled packs
Use observed trial data where possible. Supplier speed claims are not substitutes for tests on the actual line, structure, product, seal window, and format.
Product Loss and Quality Failure
A pouch carries product worth far more than the film around it. Estimate losses from leaks, weak seals, pinholes, delamination, poor barrier, zipper failure, incorrect print, odor, migration concerns, and distribution damage. Include product value, filling labor, disposal, rework, replacement freight, customer service, retailer penalties, and lost sales.
Expected failure cost can be modeled as:
Expected failure cost = probability of failure × total consequence if failure occurs
Use separate probabilities for internal scrap, warehouse discovery, retail returns, and field incidents because consequences grow later in the chain. A structure that reduces failure from 1 percent to 0.1 percent may justify a meaningful material premium when the product is expensive or the brand risk is high.
Testing and quality assurance are costs, but they also reduce uncertainty. Include incoming inspection, laboratory testing, line trials, shelf-life studies, retained samples, audits, and supplier qualification. Avoid treating these preventive costs as waste while ignoring the failures they are designed to prevent.
Distribution and Shelf Efficiency
Measure the full packed system: filled pouch, inner pack, case, pallet, and transport. A stable stand-up pouch may improve shelf presentation, but its filled shape and headspace affect case dimensions. A format that fits more saleable units per case or pallet can lower corrugated, freight, warehouse, and handling cost.
Include damage from vibration, compression, altitude, temperature, and e-commerce handling. Additional film thickness may be cheaper than secondary protective packaging, but the decision should be based on tested system performance. Avoid shifting cost from the pouch budget into a larger carton or higher damage rate without recognizing it.
Commercial and Sustainability Costs
Packaging can influence conversion, price positioning, repeat purchase, and retailer acceptance. These values are harder to isolate, but controlled market tests can compare formats, finishes, and features. A zipper may cost more yet preserve product after opening and improve perceived value. A clear window may increase trust but reduce barrier for some products.
Sustainability choices can change material price, qualification, labeling, fees, and access to recycling streams. Include any extended-producer-responsibility fees, certification costs, recycled-content premiums, downgauging trials, and disposal effects relevant to the market. Do not convert uncertain marketing benefits into guaranteed savings.
Build a Comparable Cost Model
Create one row for each option and annualize the following categories:
- Package purchase, tooling, proofs, and testing.
- Freight, duties, brokerage, receiving, and emergency logistics.
- Inventory carrying, warehouse handling, and expected obsolescence.
- Filling labor, machine time, changeover, utilities, and scrap.
- Product loss, rework, complaints, returns, and disruption risk.
- Secondary packaging, cases, pallets, storage, and distribution.
- Compliance, sustainability fees, certifications, and end-of-life obligations.
Divide annual total by expected saleable units to obtain cost per good pack. Then run sensitivity tests for volume, exchange rate, freight, scrap, line speed, and failure rate. Highlight assumptions that can reverse the decision and validate those first with trials or supplier evidence.
Total packaging cost is the cost of delivering a saleable, protected product—not the cost of buying an empty pouch. When brands compare equivalent specifications and include inventory, operations, logistics, and quality risk, the lowest-cost option often becomes clearer and more defensible.